Pre-attentive Attributes
Pre-attentive attributes are fundamental visual properties that the human brain processes almost instantly, without the need for conscious effort. This rapid perception occurs within milliseconds, allowing individuals to detect patterns, differences, and important information before actively focusing on the details. Understanding and leveraging pre-attentive attributes can significantly enhance data visualization, user interface design, and decision-making processes.
Types of Pre-attentive Attributes
Pre-attentive attributes fall into four key categories:
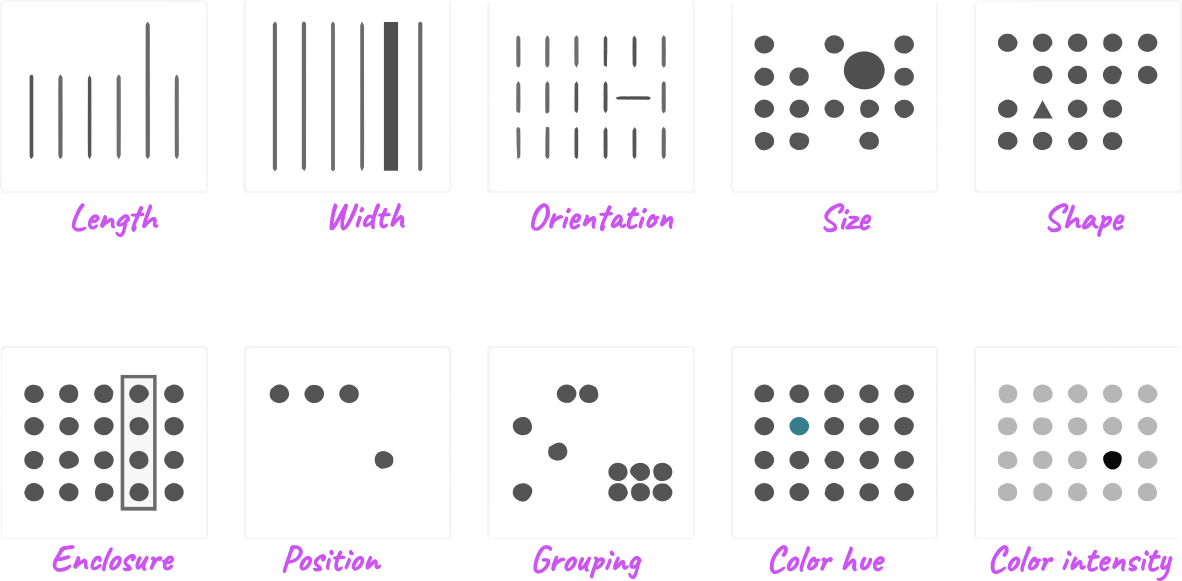
- Color – Variations in hue, brightness, or saturation can instantly draw attention. For example, a red dot among grey ones stands out immediately.
- Size – Larger elements are naturally more prominent than smaller ones. A bigger bar in a chart instantly conveys greater value.
- Shape – Different shapes can be used to distinguish data points. A triangle among circles is immediately noticeable.
- Orientation – A single tilted line in a group of vertical ones is perceived without conscious effort.
- Position – Objects placed far apart or grouped together affect how relationships are perceived.
- Motion – Movement in an otherwise static display captures attention almost instantly.
Application in Data Visualization and Decision-Making
When dealing with complex datasets, effective use of pre-attentive attributes can make insights more accessible. Instead of requiring users to manually search for patterns, visual cues help them grasp key takeaways effortlessly.
- Dashboards & Reports: Highlighting critical KPIs with color coding (e.g., red for issues, green for success) allows instant identification of trends.
- UI/UX Design: Using contrast and size variations in interfaces can guide users toward the most important actions without overwhelming them.
- Alert Systems: Changes in motion or color shifts can indicate system anomalies, prompting swift intervention.
Benefits of Leveraging Pre-attentive Attributes
- Faster Decision-Making – Reducing the time needed to interpret data improves response times.
- Reduced Cognitive Load – Users process information effortlessly, leading to better focus and comprehension.
- Improved Data Storytelling – Well-structured visuals enhance the clarity of complex insights.
- Enhanced User Experience – Intuitive design improves usability and engagement.